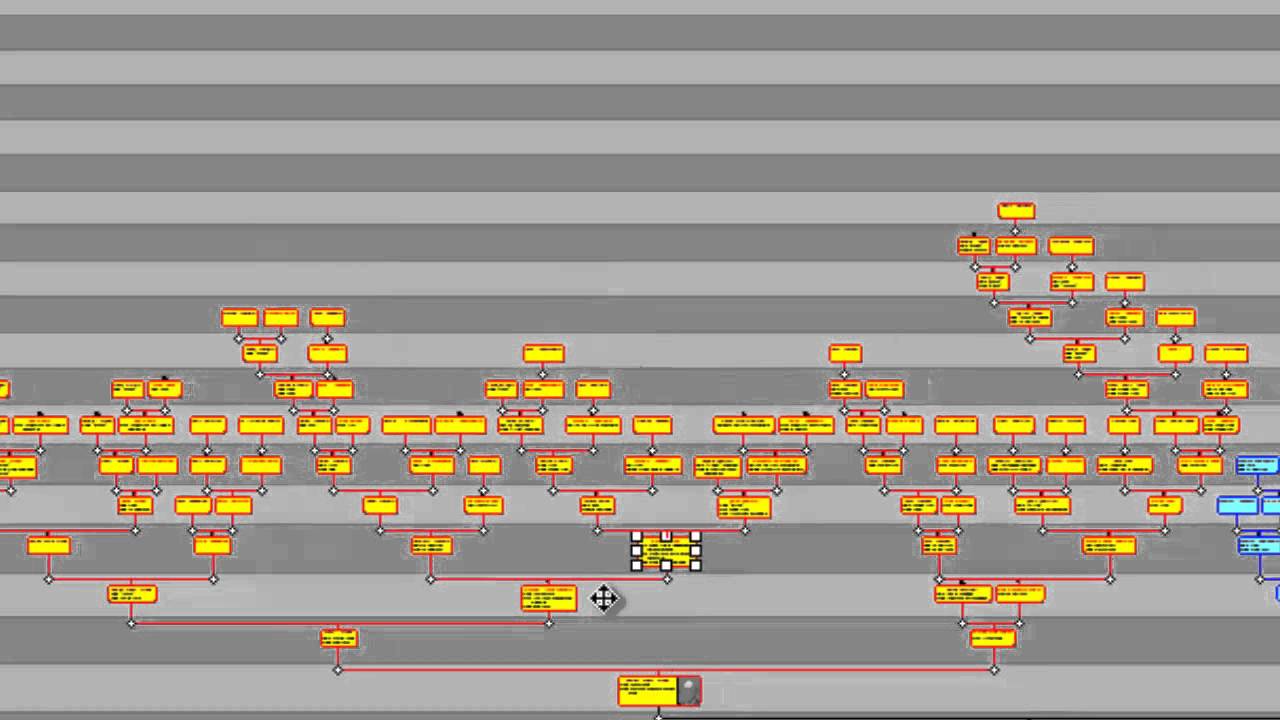
Learn how to improve the look of Family Historian diagrams by colouring tree branches distinctively to make them stand out. The video also demonstrates how to use the Family Connection Mapper tool (added in version 5) to colour lines connecting individual boxes and/or entire branch lines.
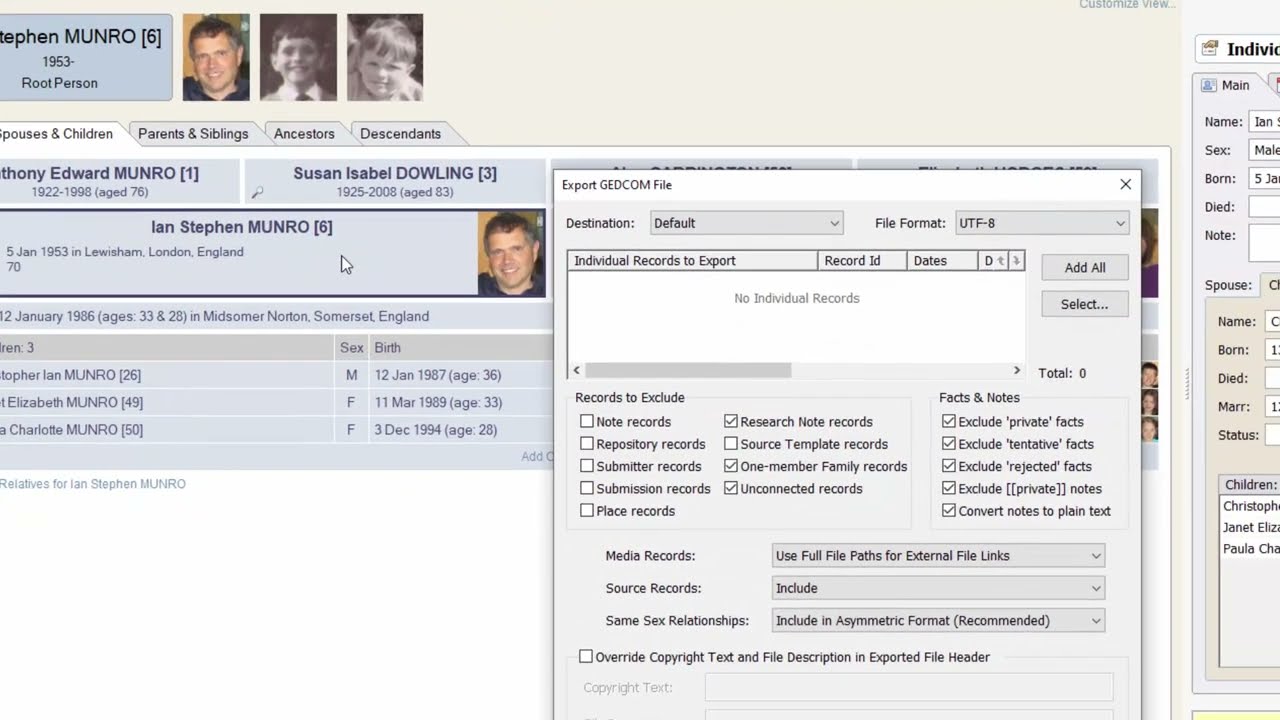
Demonstrates how to export to a GEDCOM 7 file, and how to import from a GEDCOM 7 file. Also demonstrates how to export to a GEDZIP file and import from a GEDZIP file.
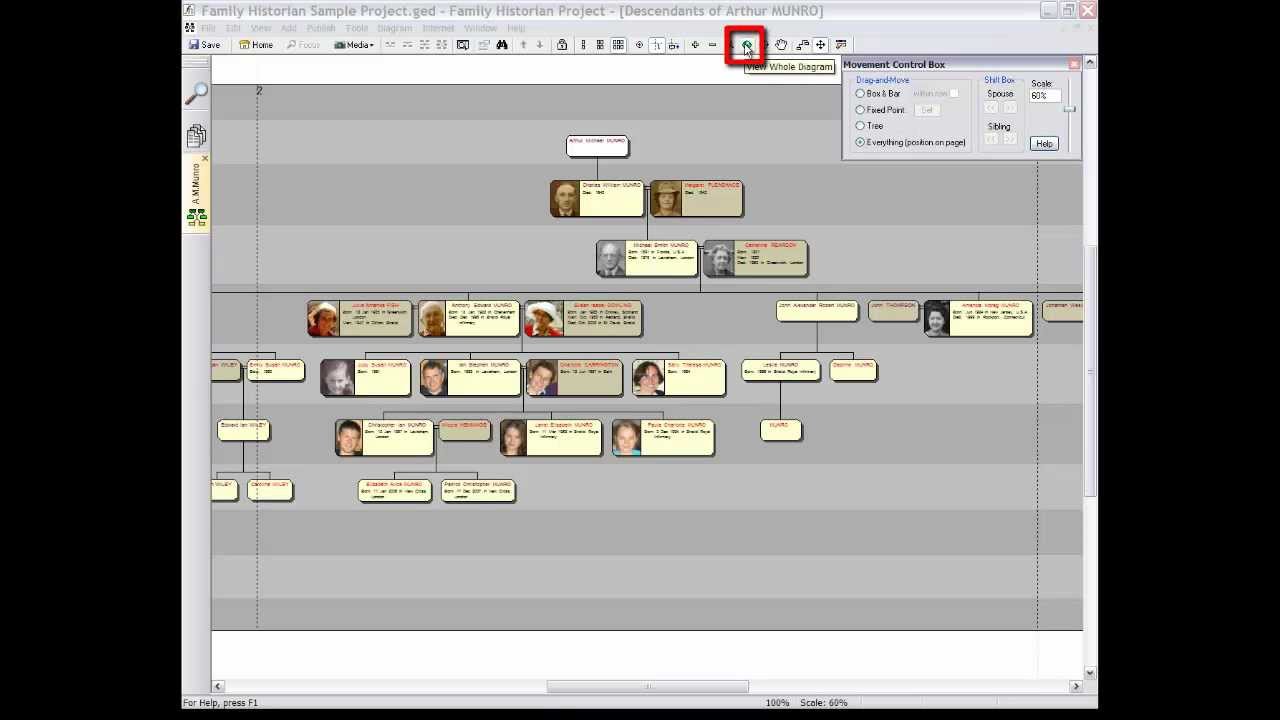
Within Family Historian diagrams, learn how to move boxes and branches, and even how to pull tree branches apart, to make them stand out from one another.
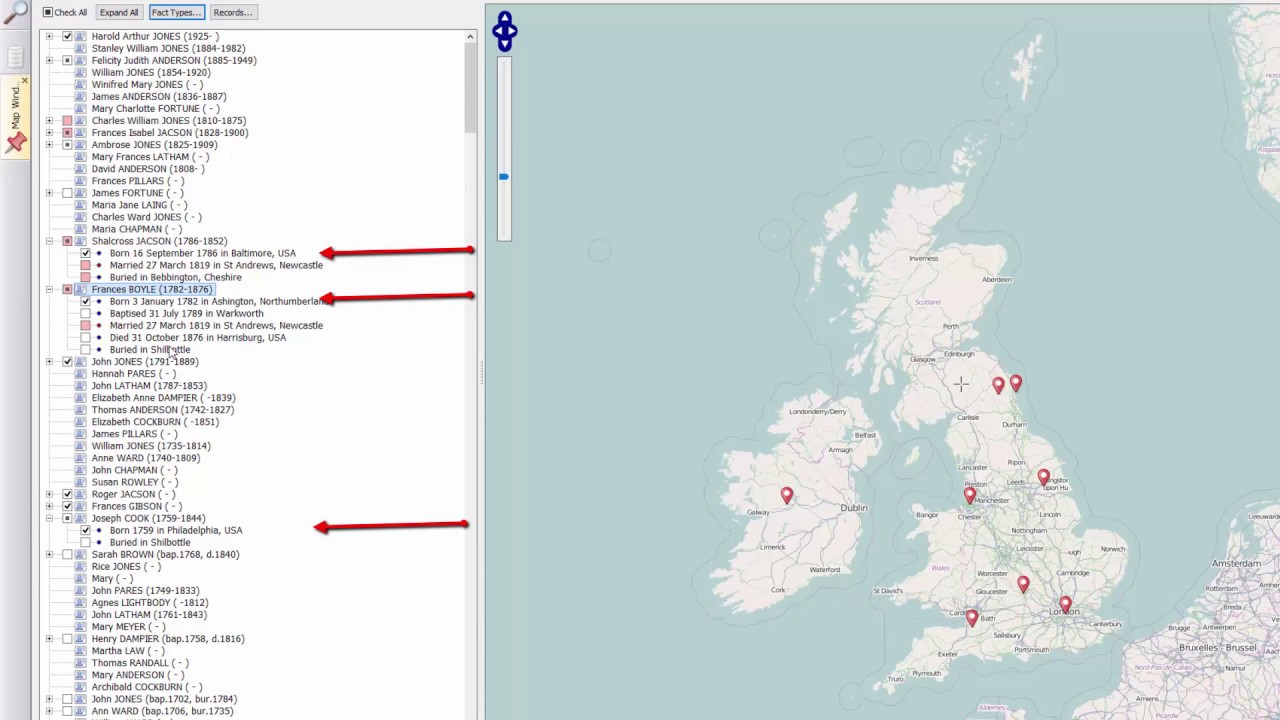
Provides an introduction to the Map Window by showing how to add multiple sets of markers to a map. One marker sets maps where a person's ancestors were born. Another set of markers mark where his wife's ancestors were born. The video also demonstrates how to use the Time Slide
Learn how to resize a Family Historian diagram to fit exactly within one sheet of paper when you print it, or if you prefer, to fit nicely over two or more sheets of paper.
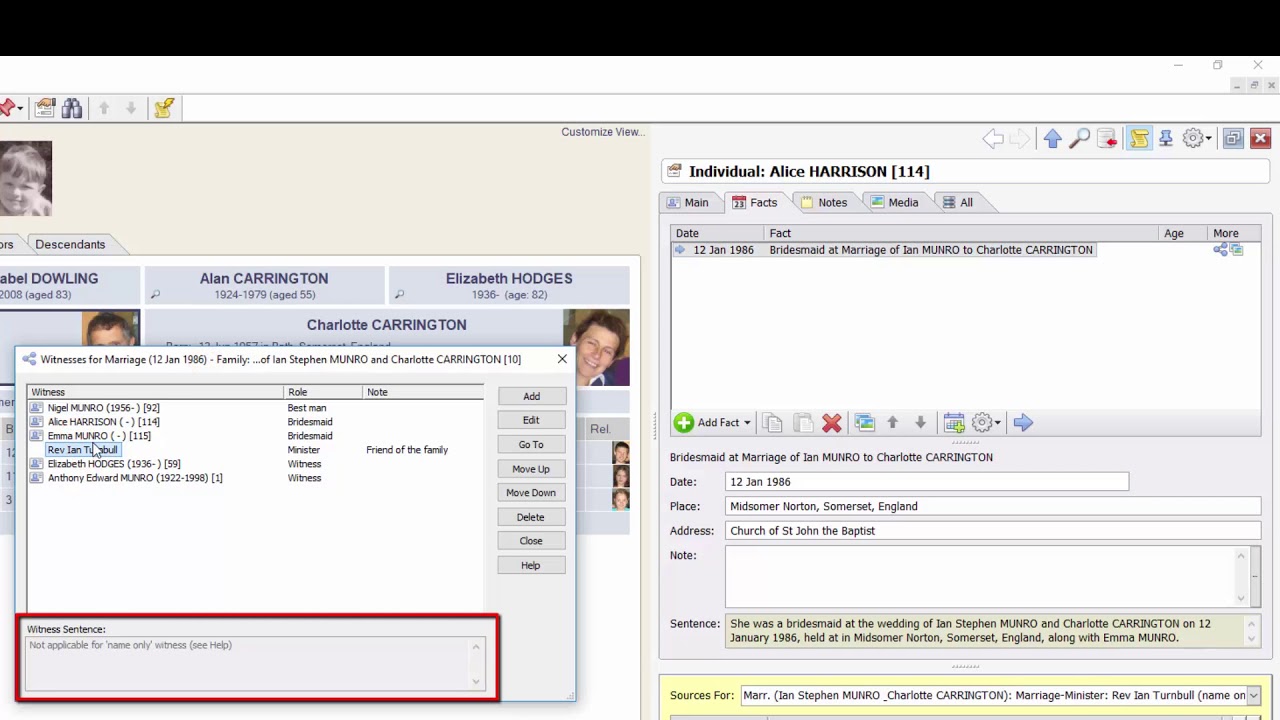
Tutorial on Family Historian, showing how to use the Witnesses feature to record special roles of participants in events. For example, it shows how to record the bridesmaids and best man at a marriage, and the executors and beneficiaries of a will.
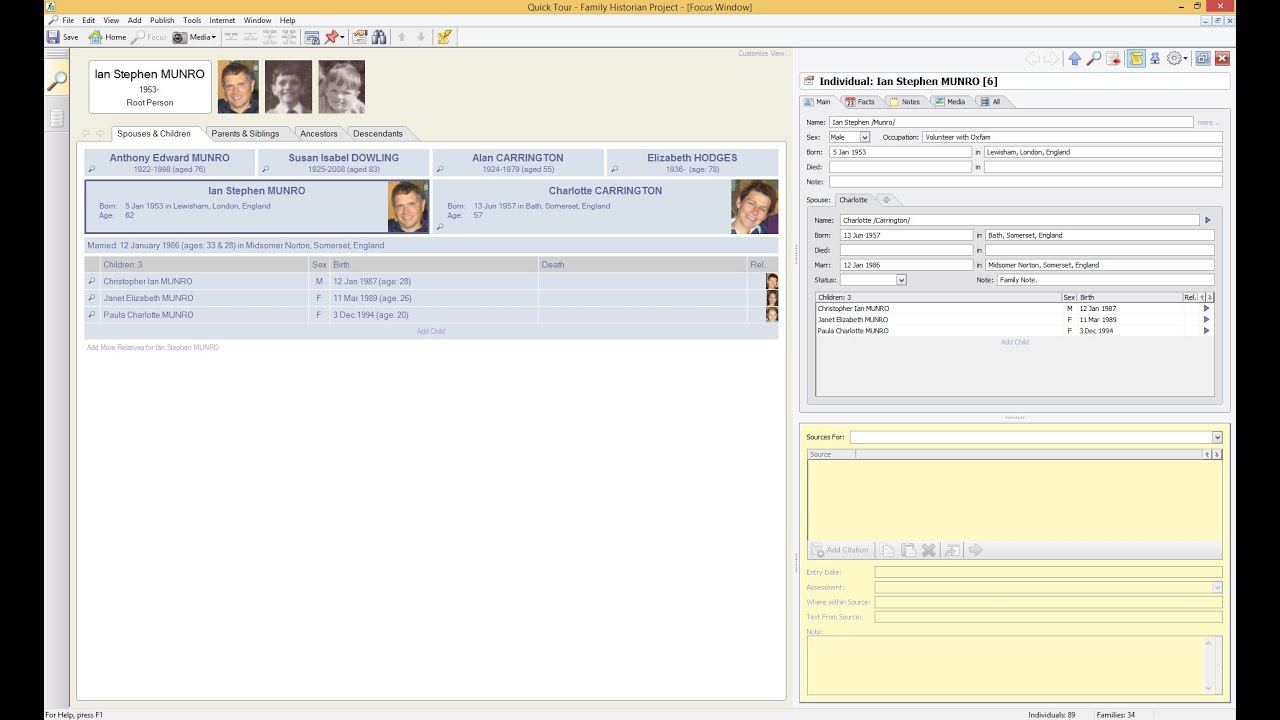
Not to be confused with the video tour of version 7 (see A Quick Tour of Family Historian 7). This is a longer, tutorial video tour of Family Historian 6, with spoken commentary.
An overview of some of the new features added in version 7 of Family Historian - including word processing features, research notes, source templates, transcription tools, data entry assistants, and more.
4 thoughts on “Making Branches Stand Out”
Margaret
I have marked the family connections with the colour lines. I then save it. When I got and add more people and then go back into the Ancestors vies none of the lines are in colour. What do I have to do to save the colour lines?
Thank you
Ros
To re-open a saved chart, use the File>Diagram>Saved Chart option, do not start a new diagram.
Margaret
Thanks. I have now added more people. How do I add them to the chart I have already saved?


I have marked the family connections with the colour lines. I then save it. When I got and add more people and then go back into the Ancestors vies none of the lines are in colour. What do I have to do to save the colour lines?
Thank you
To re-open a saved chart, use the File>Diagram>Saved Chart option, do not start a new diagram.
Thanks. I have now added more people. How do I add them to the chart I have already saved?
If you have the expansion buttons turned on just click them to open the new areas.
See https://www.family-historian.co.uk/help/fh7/hh_goto.htm?hh_start.htm#workingdiagramsandcharts.html for more information.